前端复杂 table 渲染及 excel.js 导出
转载请注明出处,点击此处 查看更多精彩内容
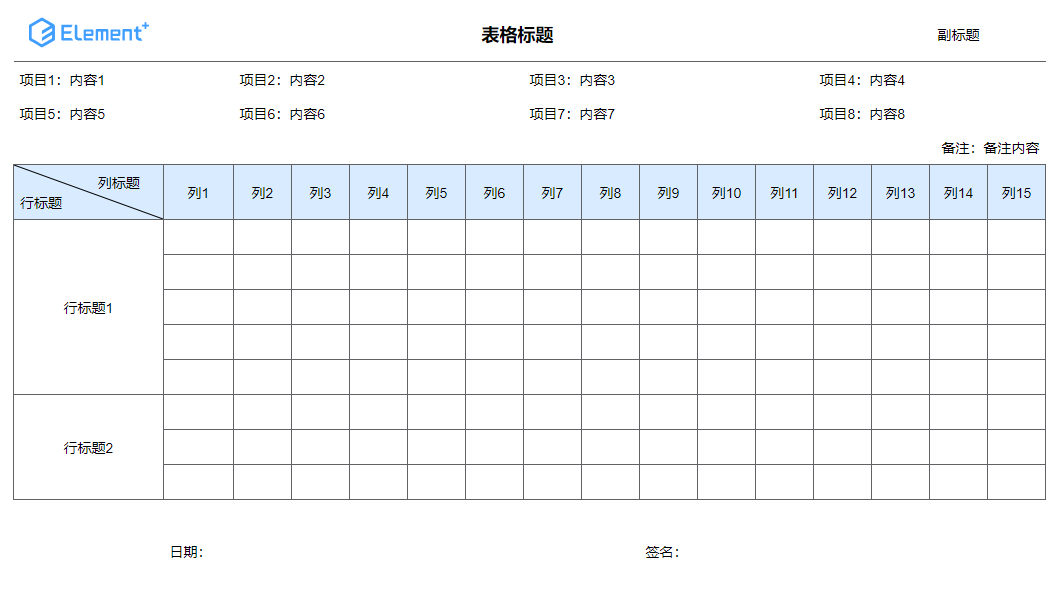
现在我们有一个如图(甚至更复杂)的表格需要展示到页面上,并提供下载为 excel 文件的功能。
前端表格渲染我们一般会使用 element-ui 等组件库提供的 table 组件,这些组件一般都是以列的维度进行渲染,而我们使用的 excel 生成工具(如 exceljs)却是以行的维度进行生成,这就导致页面渲染和 excel 生成的数据结构无法匹配。
为了解决这个问题,达到使用一套代码兼容页面渲染和 excel 生成的目的,我们需要统一使以行的维度进行数据的组织,然后分别使用原生 table 元素和 exceljs 进行页面渲染和 excel 文件生成。
功能列表
- 单元格展示文字
- 单元格文字尺寸
- 单元格文字是否加粗
- 单元格文字颜色
- 单元格水平对齐方式
- 单元格自定义展示内容(复杂样式、图片等)
- 单元格合并
- 指定行高
- 单元格背景色
- 是否展示单元格对角线
- 是否展示边框
定义单元格数据结构
首先我们需要定义单元格和表格行的数据结构。
/**
 * 表格单元格配置
 */
export interface TableCell {
  /** 展示文案 */
  text?: string;
  /** 文字尺寸,默认 14 */
  fontSize?: number;
  /** 文字是否加粗 */
  bold?: boolean;
  /** 文字颜色,默认 #000000 */
  color?: string;
  /** 水平对齐方式,默认 center */
  align?: "left" | "center" | "right";
  /** 所占行数,默认 1 */
  rowspan?: number;
  /** 所占列数,默认 1 */
  colspan?: number;
  /** 高度,若一行中有多个单元格设置高度,将使用其中的最大值 */
  height?: number;
  /** 背景颜色 */
  bgColor?: string;
  /** 是否绘制对角线 */
  diagonal?: boolean;
  /** 是否绘制边框,默认 true */
  border?: ("top" | "right" | "bottom" | "left")[];
  /** 动态属性 */
  [key: string]: any;
}

/**
 * 表格行。undefined 标识被合并的单元格
 */
export type TableRow = (TableCell | undefined)[];
TableCell 表示一个单元格,定义了单元格的基本配置,如展示文案、对齐方式、单元格合并、颜色、字体大小、边框等,可根据实际需求进行扩展。
TableRow 是由多个单元格组成的表格行,undefined 用于标识被合并的单元格。
表格渲染
基于如上表格单元格和行的定义,我们可以编写一个组件用于渲染表格。
<template>
  <div class="custom_table">
    <table>
      <colgroup>
        <col
          v-for="(width, index) in colWidthList"
          :key="index"
          :style="{ width: `${width}px` }"
        />
      </colgroup>
      <tr
        v-for="(row, rowIndex) in data"
        :key="rowIndex"
        :style="{ height: calcRowHeight(row) }"
      >
        <td
          v-for="(cell, colIndex) in row.filter((item) => !!item)"
          :key="colIndex"
          :class="[
            'table-cell',
            ...getCellBorderClass(cell),
            { 'table-cell--diagonal': cell?.diagonal },
          ]"
          :style="{
            fontSize: `${cell?.fontSize || 14}px`,
            fontWeight: cell?.bold ? 'bold' : 'initial',
            color: cell?.color || '#000000',
            textAlign: cell?.align || 'center',
            background: cell?.bgColor || '#ffffff',
            ...cellStyle?.(cell),
          }"
          :rowspan="cell?.rowspan"
          :colspan="cell?.colspan"
        >
          <slot name="cell" :cell="cell">{{ cell?.text }}</slot>
        </td>
      </tr>
    </table>
  </div>
</template>

<script setup lang="ts">
import { computed, CSSProperties } from "vue";
import { TableCell, TableRow } from "@/utils/excel-helper";

export interface Props {
  /** 表格数据 */
  data: TableRow[];
  /** 表格列宽。number[] 精确指定每列的宽度;number 表示所有列统一使用指定宽度 */
  colWidth?: number | number[];
  /** 自定义指定单元格的样式 */
  cellStyle?: (cell?: TableCell) => CSSProperties;
}

const props = withDefaults(defineProps<Props>(), {});

export interface Slots {
  cell?: (props: { cell?: TableCell }) => void;
}

defineSlots<Slots>();

// 列宽
const colWidthList = computed(() => {
  if (!props.colWidth) {
    return [];
  }
  if (Array.isArray(props.colWidth)) {
    return props.colWidth;
  }
  return new Array(props.data[0]?.length).fill(props.colWidth);
});

// 计算行高
const calcRowHeight = (row: TableRow) => {
  const heightList = row.map((item) => item?.height || 0);
  return `${Math.max(25, ...heightList)}px`;
};

// 获取边框样式
const getCellBorderClass = (cell?: TableCell) => {
  const border = cell?.border || ["top", "right", "bottom", "left"];
  return border.map((item) => `table-cell--border-${item}`);
};
</script>

<style lang="scss" scoped>
.custom_table {
  display: flex;
  width: fit-content;
  max-width: -webkit-fill-available;
  font-size: 14px;
  overflow: auto;

  table {
    flex-shrink: 0;
    border-collapse: collapse;
  }

  td {
    height: 20px;
    line-height: 20px;
    padding: 8px 6px 6px;
    text-align: center;
    white-space: break-spaces;
    word-break: break-all;
  }

  .table-cell {
    &--border-top {
      border-top: 1px solid #606266;
    }

    &--border-right {
      border-right: 1px solid #606266;
    }

    &--border-bottom {
      border-bottom: 1px solid #606266;
    }

    &--border-left {
      border-left: 1px solid #606266;
    }

    &--diagonal {
      position: relative;

      &::before {
        content: "";
        position: absolute;
        inset: 0;
        background: url(data:image/svg+xml;base64,PHN2ZyB4bWxucz0iaHR0cDovL3d3dy53My5vcmcvMjAwMC9zdmciIHdpZHRoPSIxMDAlIiBoZWlnaHQ9IjEwMCUiPjxsaW5lIHgxPSIwIiB5MT0iMCIgeDI9IjEwMCUiIHkyPSIxMDAlIiBzdHJva2U9ImJsYWNrIiBzdHJva2Utd2lkdGg9IjEiLz48L3N2Zz4=)
          no-repeat 100% center !important;
      }
    }
  }
}
</style>
该组件接收表格数据(data)、表格列宽(colWidth)、自定义指定单元格样式的回调函数(cellStyle)等参数。
该组件对外公开名为 cell 的插槽,可自定义单元格的渲染内容。
生成 excel 文件
我们通过 exceljs 完成 excel 文件的生成。
安装 exceljs
npm install exceljs
根据表格配置生成 excel 文件
import ExcelJS, { Workbook, Worksheet } from "exceljs";

/**
 * 生成 excel 文件
 */
export async function generateExcel(
  rowList: TableRow[],
  colWidth: number | number[] = []
): Promise<ExcelJS.Workbook> {
  // 创建表
  const workbook = new ExcelJS.Workbook();
  const worksheet = workbook.addWorksheet("Sheet1");
  // 插入表头和数据
  rowList.forEach((row) =>
    worksheet.addRow(row.map((cell) => cell?.text || ""))
  );
  // 合并单元格
  rowList.forEach((rowItem, rowIndex) => {
    rowItem.forEach((cellItem, colIndex) => {
      if (!cellItem) {
        return;
      }
      const colNoStart = convertColumnNo(colIndex);
      const colNoEnd = convertColumnNo(colIndex + (cellItem.colspan || 1) - 1);
      const rowNoStart = rowIndex + 1;
      const rowNoEnd = rowNoStart + (cellItem.rowspan || 1) - 1;
      worksheet.mergeCells(`${colNoStart}${rowNoStart}:${colNoEnd}${rowNoEnd}`);
    });
  });
  // 设置列宽
  let colWidthList: number[];
  if (Array.isArray(colWidth)) {
    colWidthList = colWidth;
  } else {
    colWidthList = new Array(rowList[0].length).fill(colWidth);
  }
  colWidthList.forEach((width, index) => {
    worksheet.getColumn(index + 1).width = width / 7.8;
  });
  // 设置默认行高
  worksheet.properties.defaultRowHeight = 28;
  // 设置单元格样式
  rowList.forEach((rowItem, rowIndex) => {
    const row = worksheet.getRow(rowIndex + 1);
    let maxHeight = worksheet.properties.defaultRowHeight;
    rowItem.forEach((cellItem, colIndex) => {
      if (!cellItem) {
        return;
      }
      const cell = row.getCell(colIndex + 1);
      maxHeight = Math.max(maxHeight, cellItem.height || 0);
      // 文字样式
      cell.font = {
        name: "等线",
        size: ((cellItem.fontSize || 14) * 11) / 14, // Excel 字体大小为 11
        bold: cellItem.bold,
        color: { argb: (cellItem.color || "#000000").slice(1) },
      };
      const border = cellItem?.border || ["top", "right", "bottom", "left"];
      // 设置边框
      cell.border = {
        top: border.includes("top") ? { style: "thin" } : undefined,
        right: border.includes("right") ? { style: "thin" } : undefined,
        bottom: border.includes("bottom") ? { style: "thin" } : undefined,
        left: border.includes("left") ? { style: "thin" } : undefined,
        diagonal: { up: false, down: cellItem?.diagonal, style: "thin" },
      };
      // 设置居中&自动换行
      cell.alignment = {
        horizontal: cellItem.align || "center",
        vertical: "middle",
        wrapText: true,
      };
      // 设置背景
      if (cellItem.bgColor) {
        cell.fill = {
          type: "pattern",
          pattern: "solid",
          fgColor: { argb: cellItem.bgColor.slice(1) },
        };
      }
    });
    row.height = maxHeight;
  });
  return workbook;
}

/**
 * 转换数字列号为字母列号
 * @param num
 */
function convertColumnNo(num: number) {
  const codeA = "A".charCodeAt(0);
  const codeZ = "Z".charCodeAt(0);
  const length = codeZ - codeA + 1;
  let result = "";
  while (num >= 0) {
    result = String.fromCharCode((num % length) + codeA) + result;
    num = Math.floor(num / length) - 1;
  }
  return result;
}
调用 generateExcel 函数传入表格配置即可生成一个 excel 工作簿对象 ExcelJS.Workbook。
下载 excel 文件
/**
 * 下载为 excel 文件
 * @param workbook excel 工作簿对象
 * @param fileName 文件名
 */
export async function downloadExcel(workbook: ExcelJS.Workbook, fileName: string) {
  const buffer = await workbook.xlsx.writeBuffer();
  const blob = new Blob([buffer], { type: "arraybuffer" });
  const link = document.createElement("a");
  link.href = URL.createObjectURL(blob);
  link.download = fileName;
  link.click();
}
调用 downloadExcel 函数传入 ExcelJS.Workbook 对象和文件名即可下载为 excel 文件。
图片等内容处理
当前 generateExcel 函数并未处理图片等复杂内容。
由于这些内容具有不确定性,因此,我们定义一个专门处理这些内容的回调函数。
函数声明
/**
 * 渲染图片等非普通文本的数据
 */
export type RenderAdditionalData = (
  /** 行号 */
  rowIndex: number,
  /** 列号 */
  colIndex: number,
  /** excel 工作簿对象 */
  workbook: ExcelJS.Workbook,
  /** excel 工作表对象 */
  worksheet: ExcelJS.Worksheet
) => Promise<void> | void;
将图片等内容的处理插入到 generateExcel 函数:
async function generateExcel(
  rowList: TableRow[],
  colWidth: number | number[] = [],
  renderAdditionalData?: RenderAdditionalData
): Promise<ExcelJS.Workbook> {
  ...
  // 合并单元格
  rowList.forEach((rowItem, rowIndex) => {
    ...
  });

  // 渲染图片等非普通文本的数据
  if(renderAdditionalData) {
    for (let rowIndex = 0; rowIndex < rowList.length; rowIndex++) {
      const rowItem = rowList[rowIndex];
      for (let colIndex = 0; colIndex < rowItem.length; colIndex++) {
        if (!rowItem[colIndex]) {
          continue;
        }
        await renderAdditionalData(rowIndex, colIndex, workbook, worksheet);
      }
    }
  }

  // 设置默认行高
  worksheet.properties.defaultRowHeight = 28;
  ...
}
exceljs 对图片的渲染请查询官方文档。
至此,即可完成复杂 excel 表格的渲染和导出。如需其他配置可自行扩展。